Analyzing Our Portfolios Based on Financed Emission Metrics
Climate-related risks and opportunities were analyzed for the four portfolios managed by the company: Japanese equities, global equities, Japanese bonds, and global bonds, as well as our sovereign debt portfolio. Analyses were conducted in accordance with assessment and disclosure methods, including "The Global GHG Accounting and Reporting Standard for the Financial Industry" published by the PCAF, of which we are a member. Specifically, for the four asset classes-Japanese equities, global equities, Japanese bonds, and global bonds-we utilize data and analysis methods from ISS. For benchmarks, we used TOPIX for Japanese equities and MSCI ACWI ex-Japan for global equities, NOMURA-BPI (Corporate bonds only) for Japanese bonds, and the Bloomberg Global Aggregate Index ex-Japan (Corporate bonds only) for global bonds. For bonds, the scope of this analysis is corporate bonds, with a separate analysis conducted for sovereign debt.
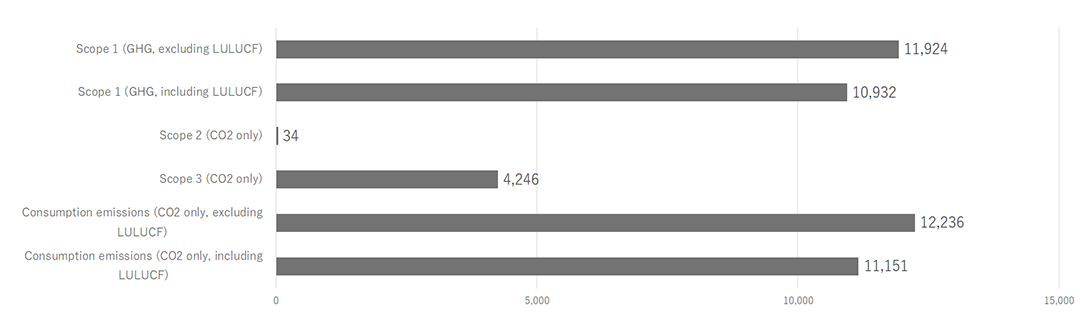
Absolute Emissions
- Emissions attributed to a financial institution's lending and investing activity.
- Unit: tCO2e(CO2 equivalent)
- GHG emissions of investee companies include Scope 1,2, and 3*1

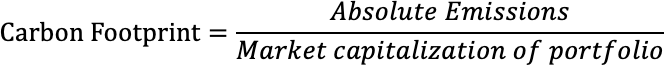
Carbon Footprint
- Absolute emissions divided by the market value of the portfolio
- Unit: tCO2e/US$ million (investment amount)
- Only Scope 1 and 2 emissions are considered for carbon footprint calculations
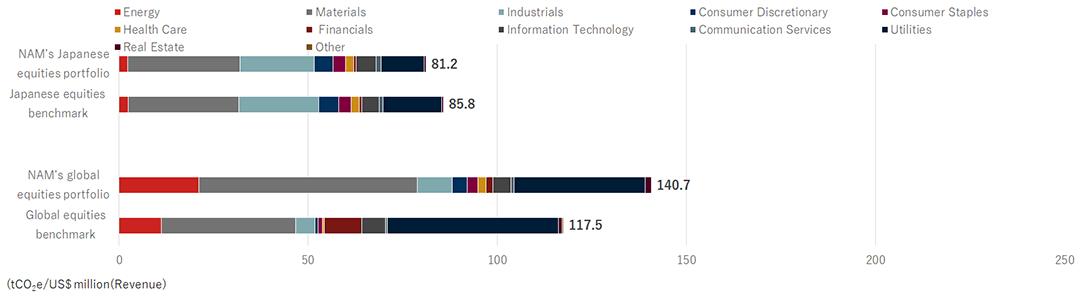
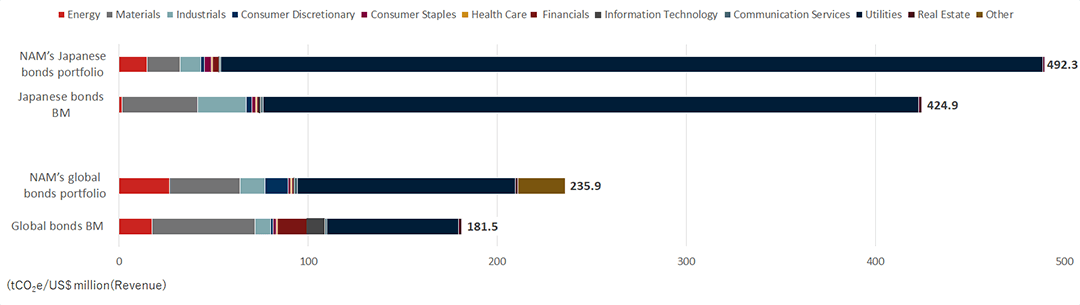
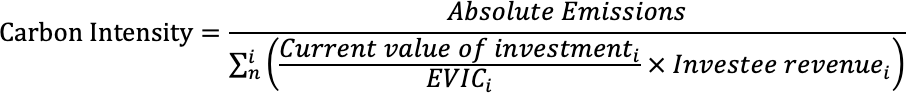
Carbon Intensity
- Absolute emissions divided by the revenue of the investee companies
- Unit: tCO2e/US$ million (revenue)
- Only Scope 1 and 2 emissions are considered for carbon intensity calculations
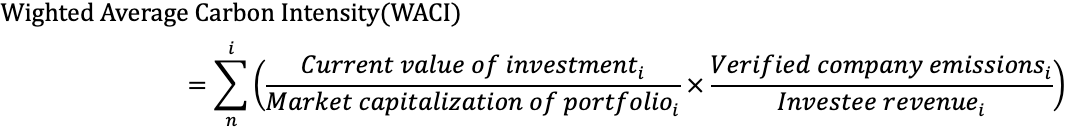
Weighted Average Carbon Intensity (WACI)
- Weighted average of each company's carbon emissions per unit of revenue, based on their weight in the portfolio.
- Unit: tCO2e/US$ million (revenue)
- Only Scope 1 and 2 emissions are considered for WACI calculations
*1 EVIC stands for Enterprise Value Including Cash. The sum of the market capitalization of ordinary shares at fiscal year-end, the market capitalization of preferred shares at fiscal year-end, and the book values of total debt and minorities' interests. No deductions of cash or cash equivalents are made to avoid the possibility of negative enterprise values.
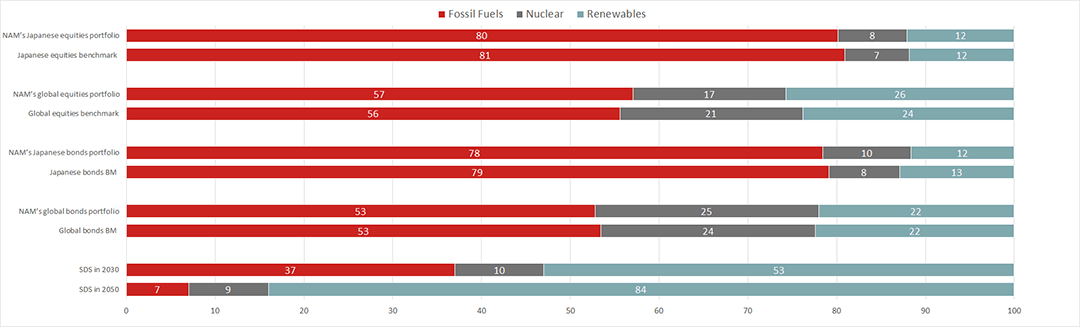
The analysis revealed that the absolute emissions (Scope 1 and Scope 2) of our Japanese equities portfolio were lower than the portfolios of the same size, comprising the same stocks and weightings as the benchmark. Additionally, our portfolios of equities (ex-Japan), Japanese bonds, and bonds (ex-Japan) slightly exceeded the benchmark emissions. We will continue to participate in climate change-related initiatives and engage with investee companies to reduce greenhouse gas emissions.
Figure 1 Absolute Emissions
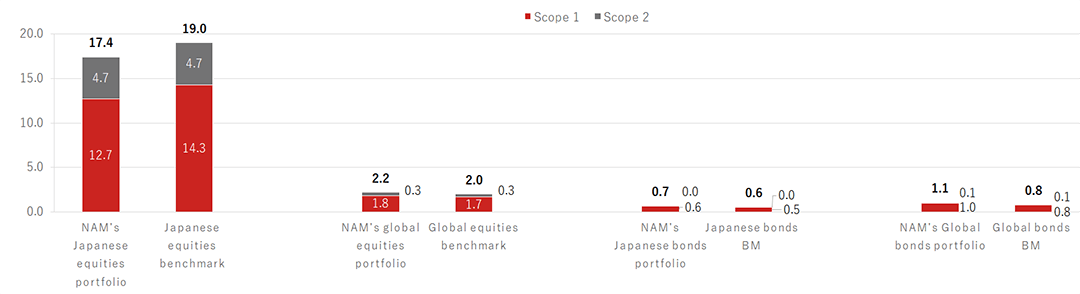
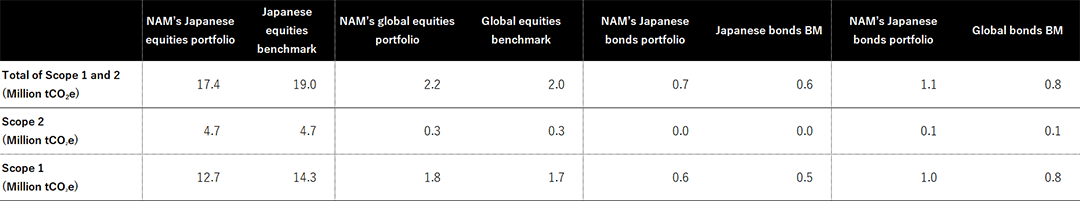
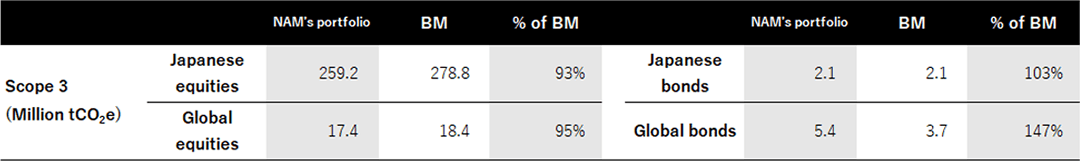
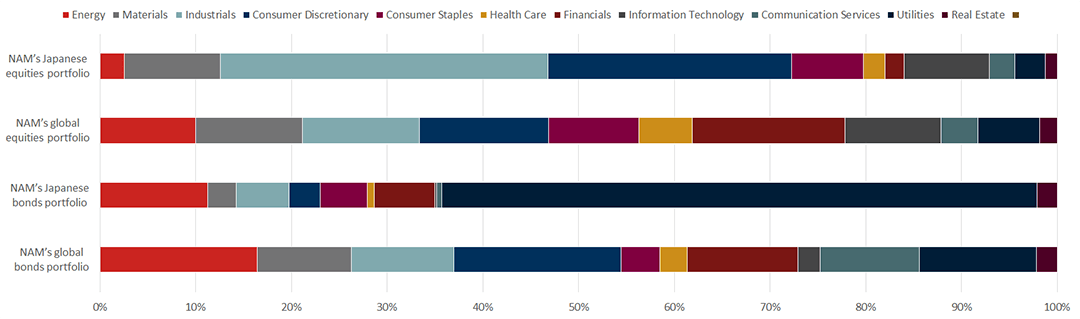
Figure 2 Ratio of Total Carbon Emissions by Industry
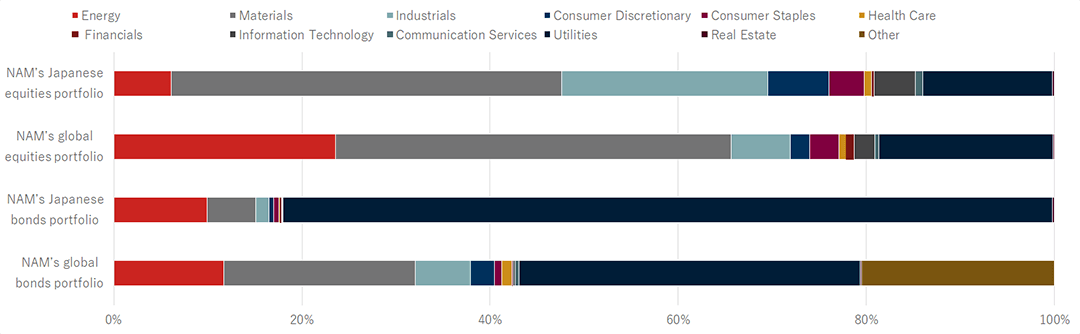
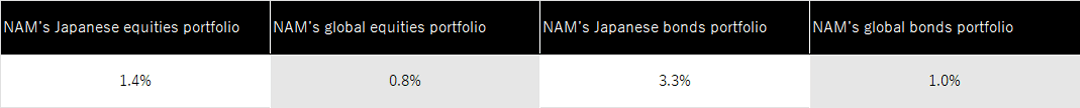
Figure 3 Carbon Footprint
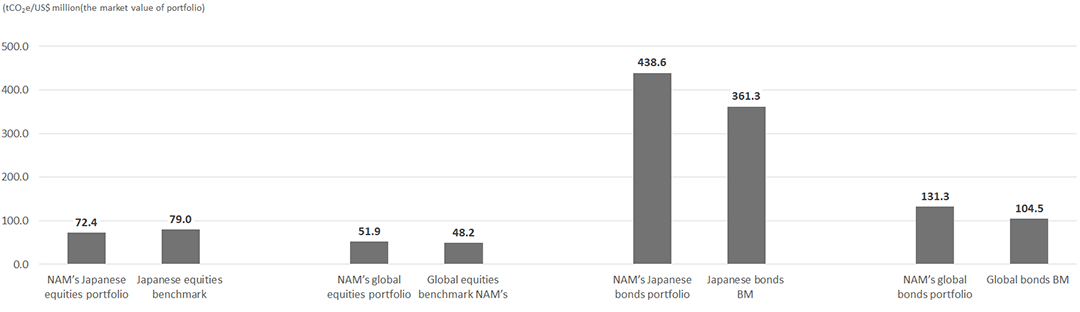
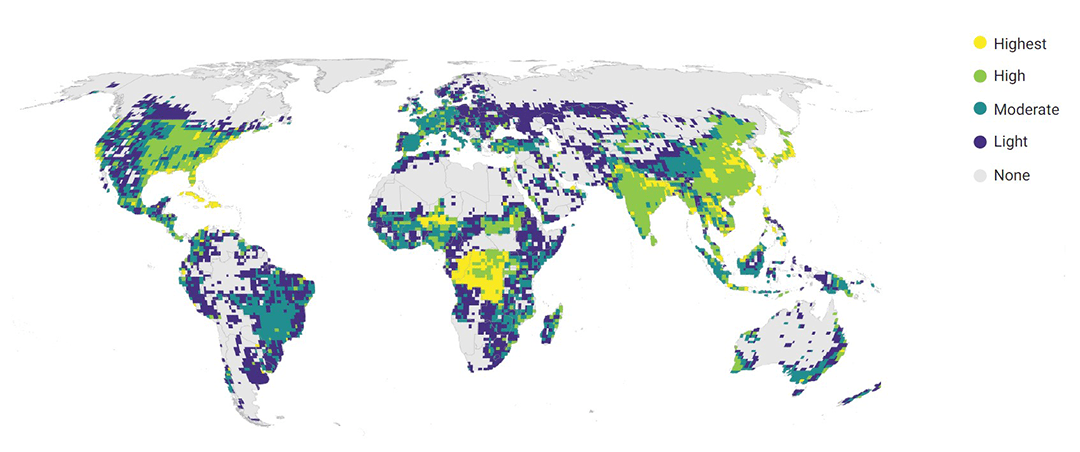
Figure 4 Weighted Average Carbon Intensity by Industry